Where is it used?
Charts report combines overview charts for run results, coverage and some other metrics. It contains only pie charts showing statistics per features, scenarios and steps respectively.
Major sections
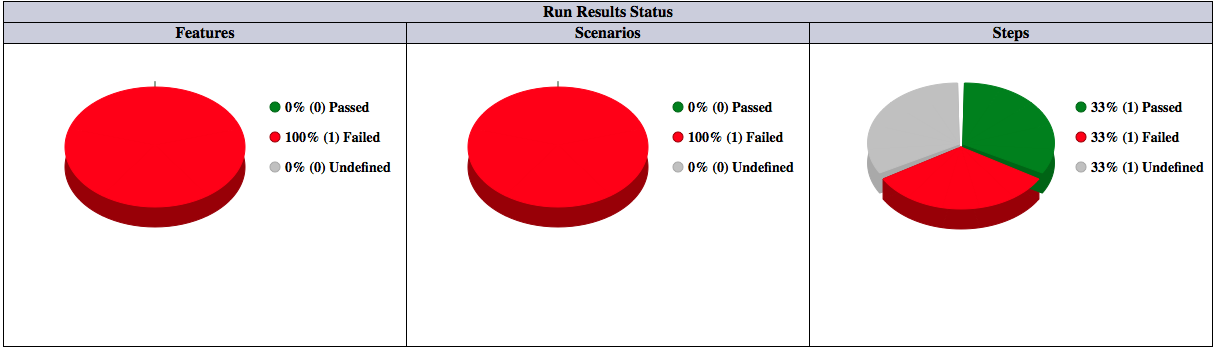
Report contains a combination of pie chart sections. Here is an example of charts containing only run results overview charts:
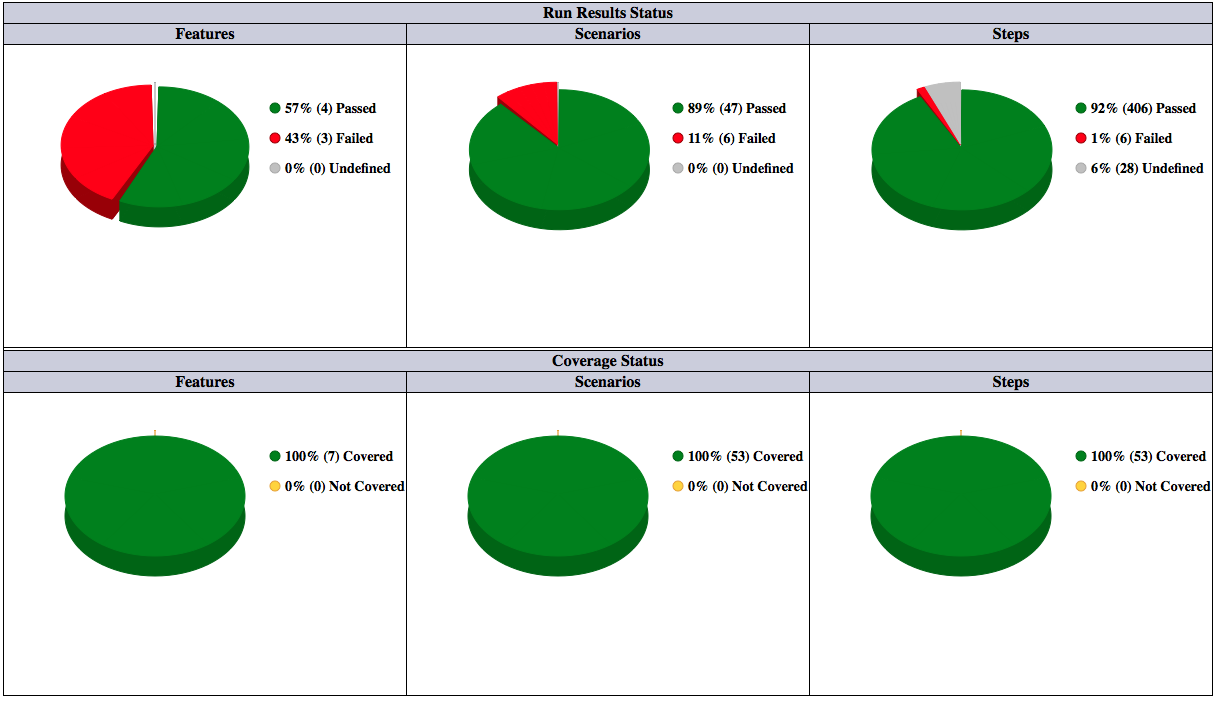
With additional settings report may also contain coverage information. Here is an example of such report:
Generation options
This report is dependent on Test Results Overview and Test Coverage reports. So, in order to generate charts for different sections we should enable overview and/or coverage reports.
If we do this from the code directly, we should invoke setOverviewReport and/or setCoverageReport methods to enable/disable some specific sections of charts report (see below examples).
For the generation from Cucumber runner corresponding sections will appear when we enable Overview and Coverage reports (see below examples).
Aggregated results
Results aggregation will be needed when we utilize failed tests re-run capability. In this case at least results overview charts will be aggregated.
If we generate report from the code directly, we may use first parameter of the execute method. If is boolean flag identifying whether aggregation should take place.
For the Extended Cucumber we need to define the detailedAggregatedReport field in the @ExtendedCucumberOptions annotation.
PDF export
This report is also exportable to PDF format. From the code this option is enabled by setting second execute method parameter to true. For the Extended Cucumber it is controlled by the toPDF field in the @ExtendedCucumberOptions annotation.
Generating report from code
The following sample generates charts report with results overview and coverage information. All results are aggregated and no PDF export is performed. The code looks like this:
ExtendedRuntimeOptions options = new ExtendedRuntimeOptions();
options.setOutputFolder("target/charts");
options.setReportPrefix("cucumber-reports");
options.setJsonReportPaths(new String[] {"src/test/resources/cucumber.json"});
options.setOverviewReport(true);
options.setCoverageReport(true);
CucumberOverviewChartsReport report = new CucumberOverviewChartsReport(options);
report.execute(true, false);
Let’s describe this example step by step.
At the beginning we just initialize runtime options with major parameters needed:
ExtendedRuntimeOptions options = new ExtendedRuntimeOptions();
options.setOutputFolder("target/charts");
options.setReportPrefix("cucumber-reports");
options.setJsonReportPaths(new String[] {"src/test/resources/cucumber.json"});
Then we enable results overview charts generation:
options.setOverviewReport(true);
And then we enable coverage:
options.setCoverageReport(true);
Having options initialized we create the reports generator instance:
CucumberOverviewChartsReport report = new CucumberOverviewChartsReport(options);
And finally we run the report:
report.execute(true, false);
Where first parameter indicates if aggregation is enabled/disabled and the second boolean flag enables/disables PDF export.
Generating report via Cucumber runner
Extended runner accumulates settings for other reports and uses them in charts reports generation. Thus, the only option which is related to charts report only is overviewChartsReport. It is the boolean flag which enables/disables charts report generation.
If we want to use overview or coverage charts we should set overviewReport and/or coverageReport flags.
Aggregation is controlled by the detailedAggregatedReport flag.
PDF export is controlled by the toPDF flag.
The entire setup for extended Cucumber runner looks like this:
    @ExtendedCucumberOptions(
            jsonReport = "target/81/cucumber.json",
            jsonUsageReport = "target/81/cucumber-usage.json",
            usageReport = true,
            detailedReport = true,
            detailedAggregatedReport = true,
            overviewReport = true,
            overviewChartsReport = true,
            pdfPageSize = "A4 Landscape",
            toPDF = true,
            outputFolder = "target/81",
            retryCount = 3)
    @CucumberOptions(
            features = { "src/test/java/com/github/mkolisnyk/cucumber/features/Test.feature" },
            tags = { "@failed" },
            glue = "com/github/mkolisnyk/cucumber/steps", plugin = {
            "html:target/81", "json:target/81/cucumber.json",
            "pretty:target/81/cucumber-pretty.txt",
            "usage:target/81/cucumber-usage.json", "junit:target/81/cucumber-results.xml" })
    public class SampleTestRetryIsOn {
    }
Here we generate just overview charts with results aggregation and PDF export (see corresponding flags setup).