Where is it used?
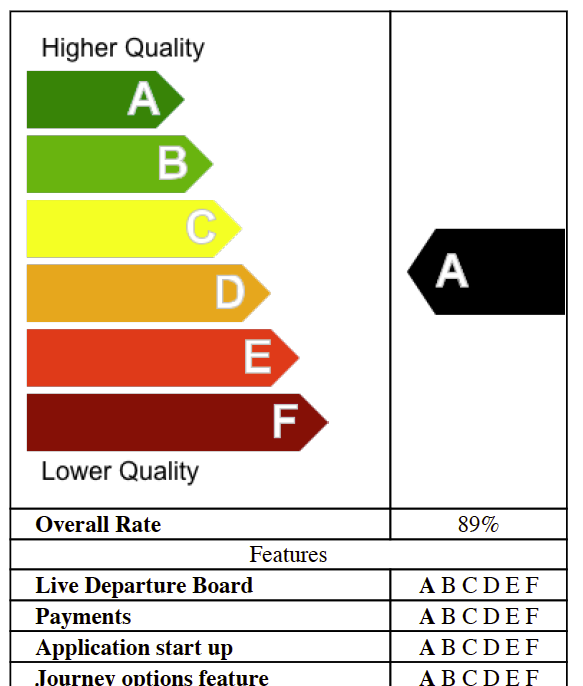
Overview chart report is another summarized visual representation of test results and it can be used as addition or alternative to the Overview Report. Such representation is convenient to view as run status view or compact enough to be posted via e-mail. Here is the typical look of the report:
Major sections
Mainly report consists of 3 parts:
- Overall quality scale
- Overall rate
- Features
Overall Quality Scale
Overall quality scale defines quality levels and shows which level current run status fits the most. The quality level represents the ration of passed tests relative to the overall number of tests. Each category determines some specific range.
The list of available categories with their relation to quality level is represented by scale image is it’s shown below:
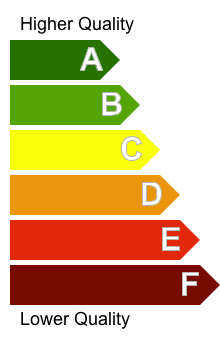
It means that we define 6 categories with letters from A to F where A indicates the highest level of quality while F corresponds to the worst.
The black arrow with the letter on the right from the scale shows actual status of current run results.
Overall Rate
Overall rate is just a small section showing the % of passed scenarios.
Features
The Features section shows overview information split by features. Each feature is set to correspondence with the status letter indicating the %pass rate in the similar way as for overall run but this time it shows quality rating for scenarios for each particular feature. Actual status is highlighted with the bold.
Generation sample
Explicit generation sample
As many other reports of this library this report uses test results JSON file as an input source. Everything else the report needs is the output directory and the output file prefix. So, typically, overview chart report can be generated with the following code:
1
2
3
4
5
CucumberFeatureOverview results = new CucumberFeatureOverview();
results.setOutputDirectory("target");
results.setOutputName("cucumber-results");
results.setSourceFile("./src/test/resources/cucumber.json");
results.execute();
Note that the parameter for the last statement indicates whether you would like to have PDF copy as well.
Using Extended Cucumber Runner
Previous example showed how we can generate report explicitly but major use is still about using Extended Cucumber Runner. Most of necessary options are defined in the ExtendedCucumberOptions annotation. The code below shows the test class sample which generates only overview chart:
1
2
3
4
5
6
7
8
9
10
11
12
13
14
15
16
17
18
19
20
21
22
@RunWith(ExtendedCucumberRunner.class)
@ExtendedCucumberOptions(
		jsonReport = "build/cucumber.json",
		jsonUsageReport = "build/cucumber-usage.json",
		reportPrefix = "sample-prefix",
		outputFolder = "build/",
		featureOverviewChart = true,
		toPDF = true
		)
@CucumberOptions(
        plugin = { "html:build/cucumber-html-report",
        		"junit:build/cucumber-junit.xml",
                "json:build/cucumber.json",
                "pretty:build/cucumber-pretty.txt",
                "usage:build/cucumber-usage.json"
                },
        features = { "src/test/java/com/sample/features" },
        glue = { "com/sample/steps" },
        tags = { "@test", "~@ignore" }
)
public class SampleTest {
}