Where is it used?
Usage report is mainly targeted to show how frequently we use each specific keyword. This report is the result of standard Cucumber Usage report post-processing. Due to that fact this report is not applicable for dry runs as dry runs do not produce any usage information.
Major sections
Overview Graph
Overview Graph is graphical representation of general usage for all the keywords. Sample usage graph looks like:
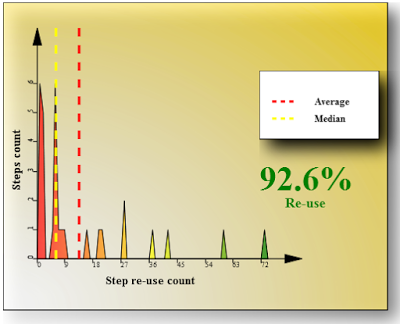
This is major item of the entire report and mainly it is enough to view it in order to get an idea about how good we are at steps re-use. The X-axis goes through the number of steps re-use. The Y-axis shows how many steps are re-used X times. So, if we see on this graph the point with dimensions like X = 28 and Y = 2 it indicates that we have 2 keywords which are re-used 28 times within the test suite.
Key numbers displayed on the graph are:
- Average number - the mathematical average. This value indicates the average steps re-use count across the entire set of steps. Since it’s mathematical average number it doesn’t reflect statistical distribution of all steps. It means that high average number may be reached even having most of the steps used just once but 1 or 2 steps are re-used big number of times. In this case mainly we don’t re-use steps but our numbers still look good. Thus our information is a bit distorted and we can get some wrong conclusions during the analysis.
- Median - the statistical average which gives more precise picture of average re-use count which also takes into account the actual distribution of the steps re-use data. It is also average number but it indicates that at least 50% of steps are re-used less than this median value times. Thus, in case of huge number of single time used steps our median will still be 1 even despite we have some steps which are re-used hundreds of times while simple mathematical average shows better number.
- Re-use Ratio - indicates that in current test suite %N of steps were written without implementing actual glue code. In order words this number means that %N of all our steps in current test suite are automated even during test design stage. So, the bigger this ratio is the more effective we use our steps.
When we analyze average values we should make sure that both of them are at least greater than 2. This means that in average we use each step at least once without necessity of spending time on writing this step implementation. This already makes Gherkin use effective. If the above numbers are bigger it’s even better. In terms of re-use ratio we just should make sure that this ratio is as big as possible. This would indicate that most of our automation is done at test design stage.
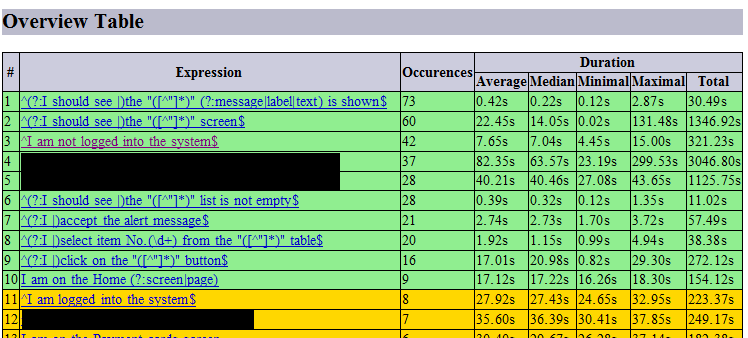
Overview Table
Shows the same data as the above graph but this data with precise numbers is grouped and represented in tabular form. It is needed just because graph has some restrictions in displaying all numbers so in some cases we cannot get precise information about actual re-use count. So, table provides this information. Additionally, each overview table row references to the detailed information on each keyword. Generally the overview table looks like:
Cucumber Usage Detailed Information
Detailed information part shows each keyword usage with all variations of all parameters the keyword is used with. E.g:
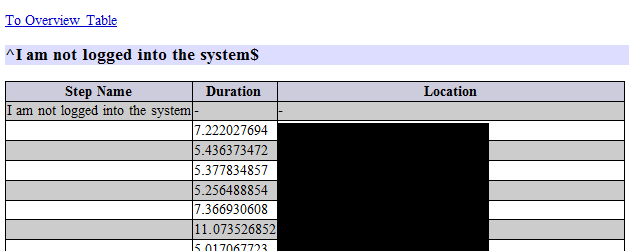
Here we can identify which parts of the keyword are really varying and how many different variations are used. Mainly, based on that information we can identify which regular expressions can be optimized or joint in order to make more effective use of keywords.
Additionally, the report provides statistical summary of steps duration in the form of barchart and summary table as it’s shown on the below picture:
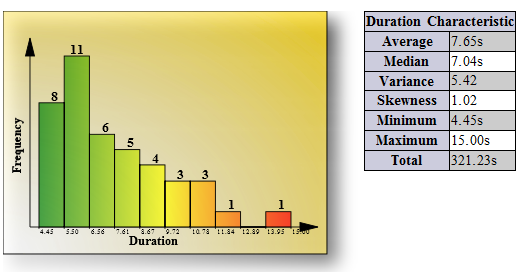
This information gives detailed picture about duration distribution for each specific keyword.
Generating report from code
The following API fragment shows how to generate usage report based on existing standard Cucumber usage JSON report (in current example it is the ./src/test/resources/cucumber-usage.json file):
1
2
3
4
5
6
7
8
import com.github.mkolisnyk.cucumber.reporting.CucumberUsageReporting;

...

CucumberUsageReporting report = new CucumberUsageReporting();
report.setOutputDirectory("target");
report.setJsonUsageFile("./src/test/resources/cucumber-usage.json");
report.executeReport();
Generating report via Cucumber runner
When we use Extended Cucumber Runner we should make sure the following:
- The standard @CucumberOptions annotation should contain plugin entry for usage report
- The @ExtendedCucumberOptions annotation should have jsonUsageReport field defined pointing to the same path as in @CucumberOptions
- The usageReport flag should be set to true
Here is the code sample generating the usage report after test execution:
1
2
3
4
5
6
7
8
9
10
11
12
13
14
15
16
17
18
19
package com.github.mkolisnyk.cucumber.reporting;

import org.junit.runner.RunWith;
import com.github.mkolisnyk.cucumber.runner.ExtendedCucumber;
import com.github.mkolisnyk.cucumber.runner.ExtendedCucumberOptions;

import cucumber.api.CucumberOptions;

@RunWith(ExtendedCucumber.class)
@ExtendedCucumberOptions(jsonReport = "target/cucumber.json",
        jsonUsageReport = "target/cucumber-usage.json",
        usageReport = true,
        outputFolder = "target")
@CucumberOptions(plugin = {"usage:target/cucumber-usage.json"},
        features = { "./src/test/java/com/github/mkolisnyk/cucumber/features" },
        glue = { "com/github/mkolisnyk/cucumber/steps" },
        tags = {"@consistent"})
public class SampleCucumberTest {
}